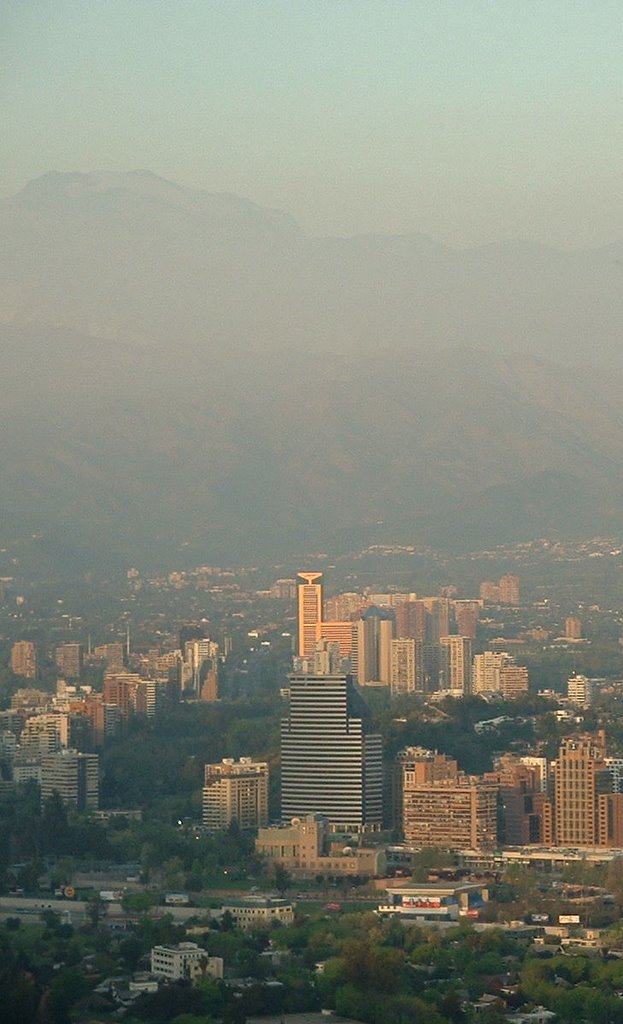
A good fifteen minutes before arrival in Santiago, we entered a cloud of smog, or “esmog” as it is known locally. Here my descriptive abilities begin to fail me. Imagine a tiny little plane flying into the smoking carriage on an intercity train, one of those that only has the one smoking carriage. The air was a bit like that, but looked dirtier. The mountains could just about be glimpsed through the grimy air, as a bulky nondescript mass, not quite the majestic soaring snow-capped peaks I had been hoping to see. I was appalled. A quick taxi ride from the airport and I was back home. My wife hugged me, sniffed me, and said “you smell smoky”. That was the smell of the Santiago air. I was quite appalled by this experience, not least because summer is the best time of the year for breathing in Santiago; the winter brings with it the worst of the smog.
Santiago with its 5.8 million people accounts for more than a third of the population of Chile. Amongst those 5.8 million people there are 970,000 cars; approximately 167 cars per 1000 inhabitants (1). This is a rate of car ownership significantly lower than other major cities in more industrialized nations, such as London (350 cars per 1000 inhabitants) (2), Paris (383 cars per 1000 inhabitants), Copenhagen (225 cars per 1000 inhabitants) and New York (210 cars per 1000 inhabitants) (3). In terms of economic development, Chile is also some distance from the more industrialized nations: with a GDP per capita of approximately US$4,590 it ranked 69th in the world according to the handy “Pocket World in Figures”, The Economist, 2006.So can the air pollution really be that bad?
The table shows a comparison for three key pollutants for Santiago and London, using data from 2001.The comparison is not ideal, as it is comparing data from two specific automatic measuring stations, but it is enough to get an idea as both are located close to the central area of each city.Looking at the annual averages, in all cases the concentrations of pollutants are higher in Santiago than in London, and the breach is even bigger looking at the 95th percentile data – this gives an idea of the more extreme air pollution events.
Concentrations of three key pollutants at automatic measuring stations in Santiago and London, 2001 (4),(5)
Annual mean | 95th percentile | |||
Santiago 2001 | London 2001 | Santiago 2001 | London 2001 | |
Pollutant (units) | Estación F | Camden | Estación F | Camden |
Ozone (µgm-3) | 27.4 | 23.0 | 100.0 | 60.0 |
Carbon monoxide (mgm-3) | 1.2 | 0.7 | 3.9 | 1.4 |
PM10 (µgm-3) | 79.0 | 29.0 | 155.0 | 56.0 |
As a reference, the European Community limit for PM10 is 30µgm-3 (annual average) (6).Still referring to 2001, the annual average concentration of PM 2.5, the fraction of particulate pollution thought to be most damaging to human health, was 35µgm-3 in the metropolitan region (Greater Santiago) (7), compared to the EC limit of 20µgm-3. Why is the air pollution much worse in Santiago, when London is bigger and has much higher car ownership? While there are a number of factors that explain the difference, one of the most significant could well be the local geography.
If you were looking to build a city in a place with good ventilation, you would do well to avoid places like the spot where Pedro de Valdívia founded Santiago in 1541. It is in a basin, surrounded by mountains on all sides except the south and south-west where there are gaps. Unfortunately, a lot of the time the wind comes from the south-west. It is a bit like having only one window open in a closed room – you need more than one opening to get a really good current of air going. It is not just horizontally that Santiago has ventilation problems. It also has bad problems with the vertical flow of air. In normal conditions, the air in the atmosphere gets cooler with increasing altitude. This means that the hot air near the earth’s surface tends to rise, dispersing pollutants upwards into the atmosphere. Sometimes, however, an “inversion layer” of hot air forms higher up in the atmosphere, trapping cooler air beneath it like a lid on a saucepan (8). This can happen in summer and in winter, but tends to happen more often in winter, which is the time of the year when the worst incidents of smog occur.
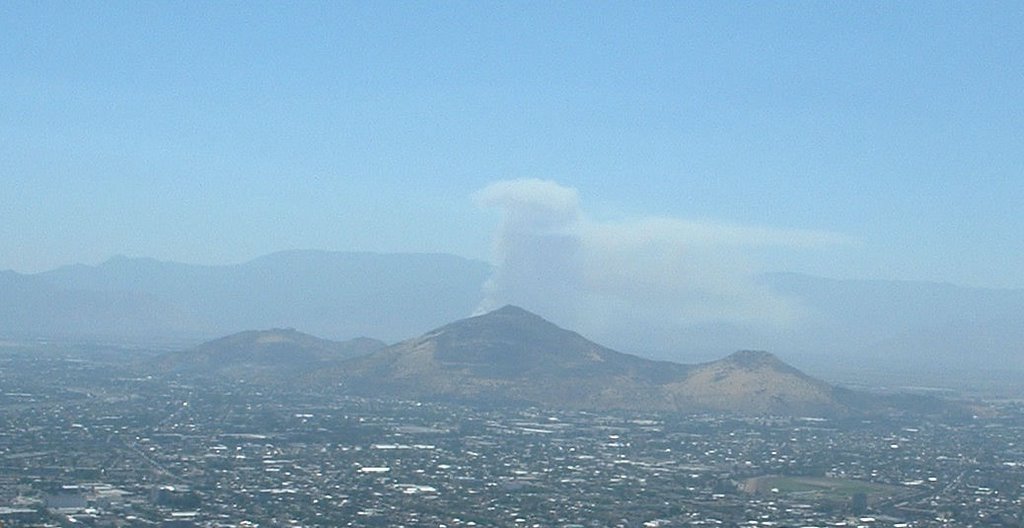
The Renca Hill - once targeted for demolition
The recent history of people trying to solve the air quality problems of Santiago is scattered with the wreckage of bold ideas and brave words (9):
- 1983 - General Sergio Badiola, head of the Metropolitan Authority, claimed “The problem of air pollution will be overcome within three years”;
- 1986 - General Osvaldo Hernández, head of the Metropolitan Authority, assured the population that the air pollution would be under control in one year’s time;
- 1989 - Reinaldo Borgel, a geographer of the Universidad Católica, together with the Military Geographical Institute and the Metropolitan Authority, proposed to dynamite the Renca Hill, as a means of opening up a ventilation corridor between Santiago and the coast.
- 1990 – “In eight years we will have finished with the air pollution”, Eduardo Arriagada, president of the Special Commission of Decontamination.
- 1992 - The engineer Heberto Castillo proposes the installation of gigantic ventilators.
- 1994 – Joaquín Lavín, then mayor of Las Condes, tried bombarding the clouds with dry ice to produce rain.Most of the water evaporated before it reached the ground.
- 1994 – The engineer Gamadiel Insulza proposes the installation of giant ventilators in Santiago, that would collect the pollutants and would send them, via a system of pipes, to underground pits.
- 1996 – not dissuaded by the failure of his earlier attempt, Joaquín Lavín tries sending aircraft to spray 60,000 litres of water over Las Condes, but once more the water evaporates before it reaches the ground.
- 1998 - The head of the Metropolitan Authority, Ernesto Velasco, starts the anti-smog campaign “one month early” by washing the streets of the capital.The experts liken the measure to “sweeping the sea”.
- 2002 – New Decontamination Plan aims to finish with the “pre-emergencies” within the next 3 years.
On the other hand, some practical measures have been adopted (10):
- 1978 – Limits defined for Nitrogen Dioxide, Carbon Monoxide, Total Suspended Particles and Ozone.
- 1987 – the start of the system of restricting vehicular access to central Santiago at times of poor air quality (the system works by blocking the entry of vehicles whose license plates end in List X, where the numbers included in List X are changed by rotation and according to the intensity of the air pollution);
- 1988 – vertical exhaust tubes become mandatory for buses. The Ministry of Transport suggests clearing the smog by bombarding the cloud of smog with chemicals;
- 1989 – The start of the present system of automatic measuring stations to monitor air pollution in the capital.
- 1990 – The Master Plan for Santiago aims to reduce by 20% the emissions from point sources, impose additional vehicular restrictions and ban the burning of wood and coal.
- 1991 – Limit established for PM10 particulates.
- 1992 – A law is passed to force industry to reduce its emissions to a certain level within 6 years. Those polluters not complying will be shut down on critical days and must compensate for their excess emissions.
- 1998 – start of the present system of forecasting critical air quality episodes, that gives 24 hours advance warning.
- 2000 – The Council of Ministers of the Environmental Commission approves applying vehicular restriction to vehicles with catalytic converters on “pre-emergency” and “emergency” days.
- 2002 – New Decontamination Plan with 18 measures, including phased renovation of the bus fleet, changes to emission limits, revised vehicle fuel regulations, amongst others.
Santiago has had some gloomy moments in recent years, like in 1991 when the WHO ranked the Chilean capital as being the third most polluted city in the world. However, it now seems as if the range of measures that have been adopted to deal with the air pollution are having some effect. While the government did not meet its target of zero pre-emergencies in 2005 (the first took place on the 17th of April), and some of the changes that were promised in the latest Decontamination Plan have been delayed, the trends since 1997 have been positive: significant reductions in the concentrations of key pollutants, and reductions in the numbers of critical events. The “pre-emergencies” have been steadily getting fewer in number, and there have been no full “emergencies” since 1999 (11).
While there are some reasons to be optimistic, there is no room for complacency if further improvements are to be made. Chile’s recent energy supply problems caused some industrial energy users to switch from natural gas to more polluting fuels, perhaps the key reason for the failure to meet the target of zero “pre-emergencies” in 2005. The rate of car ownership will almost inevitably continue to grow in coming years, and there is plenty of room for growth judging by the levels reached in more developed countries. On the other hand, this is no reason to be pessimistic, providing that sensible planning processes and policies are implemented and kept in place.
Car ownership in the UK is much higher today than it was in the 1950s, but there has been no repeat of the terrible smog that struck London in 1952. This is partly because it was so terrible that it prompted the Clean Air Act of 1956 and the Clean Air Act; Tall Chimneys of 1968 (12). Today there are ongoing efforts to keep air pollution under control in the UK, and with good reason. While London does not suffer from Santiago’s geographical conditions, relentlessly rising traffic has replaced coal smoke with vehicle exhaust fumes as the number one cause of air pollution. London was struck by a serious smog incident once more in 1991, although not quite a real "pea souper" as they used to be known (13). My mother recently recalled that during the great smog of 1952 it was difficult to see your hand in front of your face in the daylight.
Santiago has much less capacity to tolerate air pollution than other cities, mostly due to its geography and climate, and this is something that the population and its government must learn to live with. No amount of brave words nor dynamite will solve the air pollution problems of this growing metropolis. Perhaps the intolerant natural environment of the city can be turned from an enemy into an ally. Adaptation and evolution are needed, and the measures currently in the process of implementation would appear to be steps in the right direction. One of the main dangers is underestimating the difficulty of the challenge: too many times in the past have people rashly promised to have the problem of air pollution beat in the next few years. Efforts must be focussed on continuously taking significant steps in the right direction, and on keeping going, not letting up. I would like to think that one day in the near future, Santiago will be seen not as a modern case study in the health hazards of air pollution, but as a modern example of how to solve the problems of air pollution.
Sources
(1) Diagnóstico del sistema de transporte público, http://www.transantiago.cl/web2005/presentaciones.htm
(2) Mayor of London – Transport Strategy – Facts and Figures, http://www.london.gov.uk/mayor/transport/facts-and-figures.jsp#cars
(3) International Association of Public Transport, http://www.uitp.com/home/index.cfm
(4) Santiago data: Estadísticos del Medio Ambiente 1999 – 2003, INE, http://www.ine.cl/ine/canales/chile_estadistico/medio_ambiente/pdf/anuario2003.pdf
(5) London data: http://www.airquality.co.uk/
(6) Cinthya Arguedas Gourzong (2002), Análisis de las Normas de Calidad de Aire en Chile, Estados Unidos, México y la Comunidad Europea, SESMA
(7) Evolución de la Calidad del Aire en Santiago 1997-2003, CONAMA, http://www.cmmolina.cl/1708/articles-64917_pdf.pdf
(8) “Thermal Inversions and Photochemical Smog”,http://daphne.palomar.edu/calenvironment/smog.htm
(9) Elizabeth Simonsen (2002) 4.000 chilenos morirán este año por la contaminación, Qué Pasa 26th April 2002.
(10) Ibid.
(11) CONAMA, op. cit.
(12) The Great Smog of 1952, Met Office. http://www.met-office.gov.uk/education/secondary/students/smog.html(13) Michelle L. Bell, Devra L. Davis, and Tony Fletcher (2004) A Retrospective Assessment of Mortality from the London Smog Episode of 1952: The Role of Influenza and Pollution. Environmental Health Perspectives Volume 112, Number 1, January 2004 http://ehp.niehs.nih.gov/members/2003/6539/6539.html